
DRAFT. DRAFT. DRAFT. DRAFT. DRAFT.
Delta-RS Proof: Why Late Data Matters More Than You Think
When the dashboards look good, that’s usually where most projects stop. In a well-designed architecture, that’s not the end of the story — it’s where scrutiny by the business at the consumption layer begins.
How many times has someone asked, “Is this accurate?” If the number changes — even slightly, especially when that change is statistically significant — the entire process comes into question.
🧱 The architecture is proven, and the data pipeline is solid. Early validation checks already confirmed structure and completeness through row counts and sampling. The challenge now is managing what happens after ingestion — detecting late arrivals, reconciling anomalies, and documenting every corrective decision transparently.
That’s the data engineer’s responsibility. No excuses. Delta-RS exists to make that responsibility measurable, repeatable, and auditable. We’ll see.
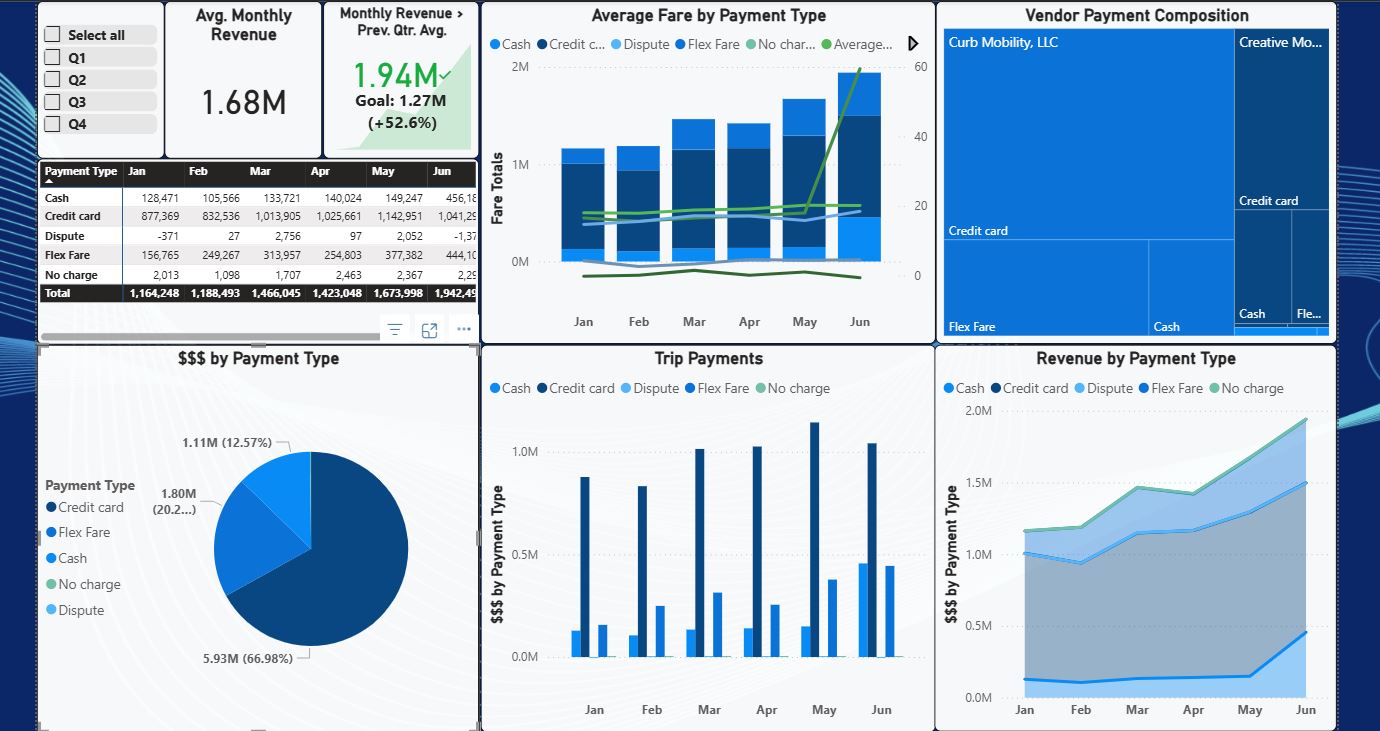
My Power BI dashboard for NYC Taxi data looks solid — average monthly revenue, fare totals by payment type, vendor and payment type composition—clean visuals across six months of data. For the purpose of a PoC, I’m backing out Q2.
Everything reconciles beautifully… until April arrives, bringing a statistically significant volume of late data that should have been included in Q1.
Business Context: The Impact of Late-Arriving Data
The dataset represents about 2% of real-world NYC Taxi traffic, roughly $1.5M in fare totals for the first quarter—sampled using Bernoulli sampling . . . more on this later.
Scaled up, that’s equivalent to around $75M+ in actual monthly revenue.
Now imagine what happens when 0.5% of that revenue arrives late or needs correction:
| Example | Hypothetical Value | Business Impact |
|---|---|---|
| True quarterly gross | $215 M | 100% baseline |
| Commission rate | 30% | $64.5 M in commissions |
| Data correction (0.5%) | $10.75 M | Direct financial exposure |
| Reconciliation lag | 1 month | Delayed trust + missed insights |
That small shift affects everyone — drivers, vendors, regulators, accountants, and executives.
When your business is measured in billions, even a fraction of a percent matters.
The Core Problem: Reporting Instability
Late-arriving rides mean revenue from January, February, or March may suddenly increase or decrease after the books were “closed.”
Traditional pipelines can’t handle this gracefully:
- Rebuild risk: Re-running entire ETL chains to capture corrections.
- Dashboard drift: KPIs shift after the fact — “Wait, why did March change?”
- Audit pain: No version history or explanation trail.
In other words, the data looks right today, but it’s not trustworthy tomorrow.
The Solution: Delta-RS on MinIO
Enter Delta-RS, an open-source, Rust-based implementation of the Delta Lake format.
It brings ACID transactions, schema enforcement, and time travel to our S3-compatible MinIO bucket — without adding external dependencies or complexity.
🧩 The stack:
- A microcosm of a cloud lakehouse:
- MinIO = S3/ADLS
- Delta-RS = Delta/Iceberg metadata engine
- PolyBase = SQL-to-lake connector
- Power BI = semantic/BI layer
Here’s how I intend to prove it.
The Proof Plan
Each small demo connects a technical behavior to a business guarantee:
| Step | Demo | Business Outcome |
|---|---|---|
| 1. Create v1 (Baseline) | Write Jan–Mar to Delta | “This is the frozen Q1 report.” |
| 2. Append v2 (Late Arrivals) | Append April + late Q1 rides | “We can accept corrections safely.” |
| 3. Schema Enforcement | Attempt to append invalid data | “Bad data can’t enter the system.” |
| 4. Schema Evolution | Add a new nullable column (promo_code) |
“We evolve without breaking dashboards.” |
| 5. Time Travel | Compare version 1 vs 2 in Power BI | “We can show what changed and when.” |
| 6. Audit View | List commit history | “Every update is traceable — who, what, when.” |
Why It Matters
“With Delta-RS, we can tell the business exactly what changed and why when late data arrives — while keeping the live dashboard stable.
No guessing. No reloads. No broken reports.”
This is the difference between reporting numbers and trusting numbers.
Delta-RS gives us the foundation for both:
- Data consistency for engineering
- Version transparency for governance
- Historical clarity for auditing and finance
What’s Next
In the next post, we’ll begin Demo #1: Creating the Delta Table (v1)
We’ll write just 10 rows, capture the first _delta_log JSON file, and explain why that single transaction file is the key to making business data trustworthy — even when reality arrives late.
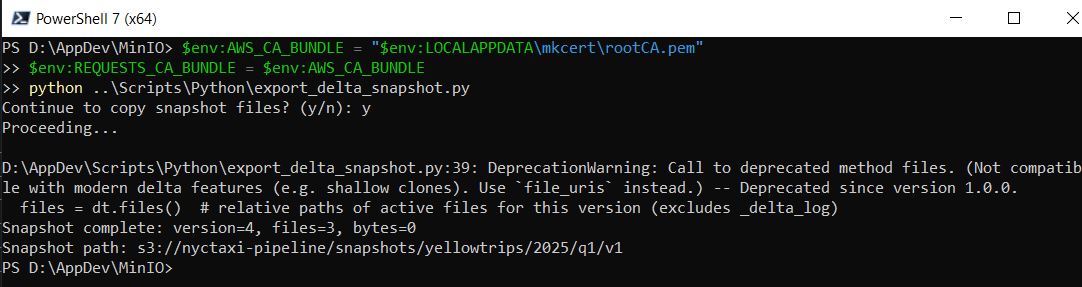
Export Delta Snapshot Output
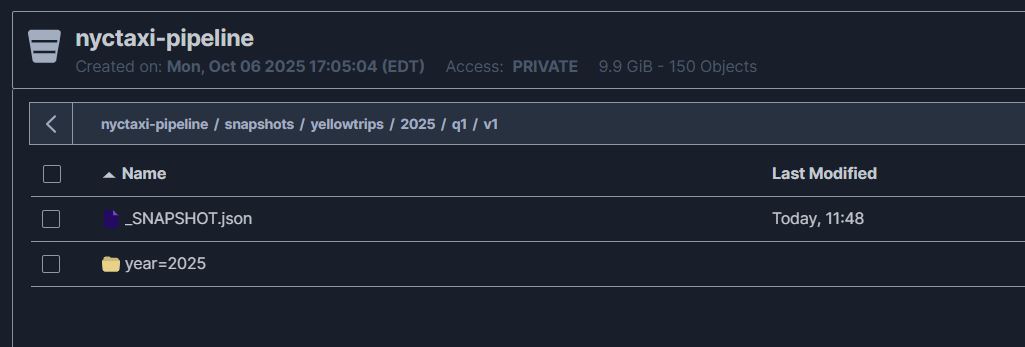
How this looks from the MinIO Console
Query the Snapshot
- Create External Tables for each month of the Quarter (Q1)
USE [NYCTaxi]
GO
SET ANSI_NULLS ON
GO
SET QUOTED_IDENTIFIER ON
GO

CREATE EXTERNAL TABLE [ext].[YellowTrips_Snapshot_2025_01]
(
	[VendorID] [int] NULL,
	[tpep_pickup_datetime] [bigint] NULL,
	[tpep_dropoff_datetime] [bigint] NULL,
	[passenger_count] [int] NULL,
	[trip_distance] [float] NULL,
	[RatecodeID] [int] NULL,
	[store_and_fwd_flag] [nvarchar](1) NULL,
	[PULocationID] [int] NULL,
	[DOLocationID] [int] NULL,
	[payment_type] [int] NULL,
	[fare_amount] [float] NULL,
	[extra] [float] NULL,
	[mta_tax] [float] NULL,
	[tip_amount] [float] NULL,
	[tolls_amount] [float] NULL,
	[improvement_surcharge] [float] NULL,
	[total_amount] [float] NULL,
	[congestion_surcharge] [float] NULL,
	[airport_fee] [float] NULL
)
WITH (
	DATA_SOURCE = [LocalS3],
	LOCATION = N'snapshots/yellowtrips/2025/q1/v1/year=2025/month=1',
	FILE_FORMAT = [ParquetFF],
	REJECT_TYPE = VALUE,
	REJECT_VALUE = 0)
GO
Is It Customary to Create Monthly External Tables?
Yes — this is a standard, professional pattern for working with Parquet files through PolyBase (or external tables in general).
Here’s how seasoned engineers think about it.
✅ Why “One External Table per Partition” Is Common
-
Predictable pruning:
PolyBase doesn’t automatically detect folder partitions (likeyear=2025/month=1/), so targeting each partition directly ensures SQL Server scans only the files you intend. -
Stable semantics:
Each external table represents a fixed data slice. Quarterly or annual views (UNION ALL) are simple, transparent, and fast.
Power BI sees a consistent schema every time. -
Versioning support:
Snapshot-based paths (e.g.,/q1/v1/) map cleanly to independent external tables.
Comparev1vsv2without conflicts or accidental overwrites.
⚙️ Common Variations in the Wild
| Pattern | LOCATION Example | Pros | Cons |
|---|---|---|---|
| Per-Month Table | .../year=2025/month=1/ |
Fine-grained control; best pruning; easy to replace individual months | More objects to manage |
| Per-Quarter Table | .../q1/v1/ |
Fewer objects; still partitioned | Slightly larger scans |
| Per-Version Table | .../2025/q1/v1/ |
Easy snapshot management | No per-month control |
| Ad-hoc OPENROWSET | Direct S3/HTTPS path | Great for testing | Not stable or reusable |
💡 When to Keep Your Current Approach
- You want exact control over each month’s snapshot.
- You’re implementing immutable Delta-RS versions (Q1 v1, Q1 v2, etc.).
- You value transparent lineage — table name ↔ folder path.
The pattern makes sense in data-governed or reproducibility-focused environments (finance, healthcare, regulated analytics).
It’s also ideal for a Power BI dual-view model — “Current” vs “Snapshot.”
🔧 Best Practices
- Keep naming consistent:
ext.YellowTrips_Snap_2025_01…_12,vw_YellowTrips_Snapshot_2025_Q1. - Reuse shared resources:
One[LocalS3]data source and one[ParquetFF]file format. - Lock schemas in views:
WITH SCHEMABINDINGfor stable Power BI relationships. - Optionally, automate:
Generate the 12 external tables and 4 quarterly views from a simple script template (e.g., looping through months).
In short: this approach is not only valid — it’s what seasoned professionals use when precision, immutability, and verifiable lineage matter more than convenience.
Power BI Dashboard—Q1 plus Q2
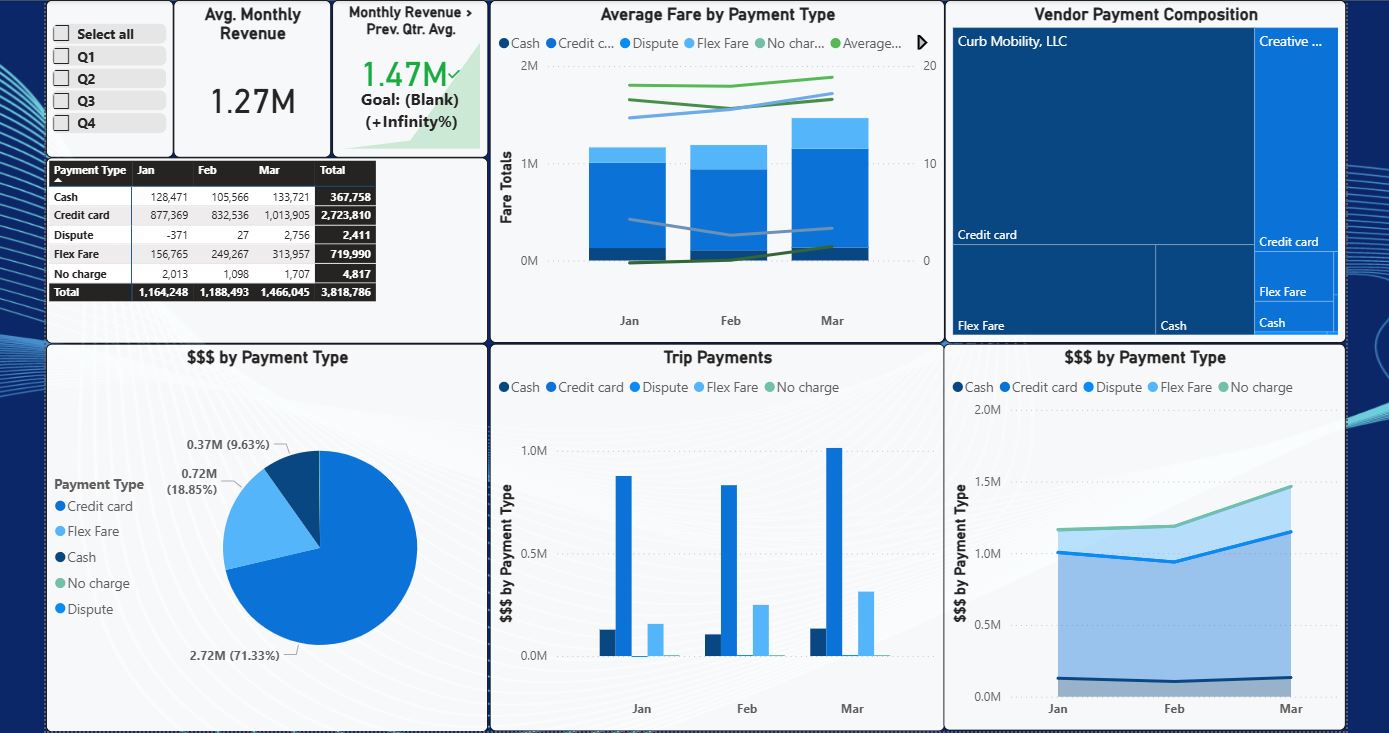
Power BI Dashboard—Snapshot
⬆ Back to Top 🧭 Working . . .